
Figures 6.
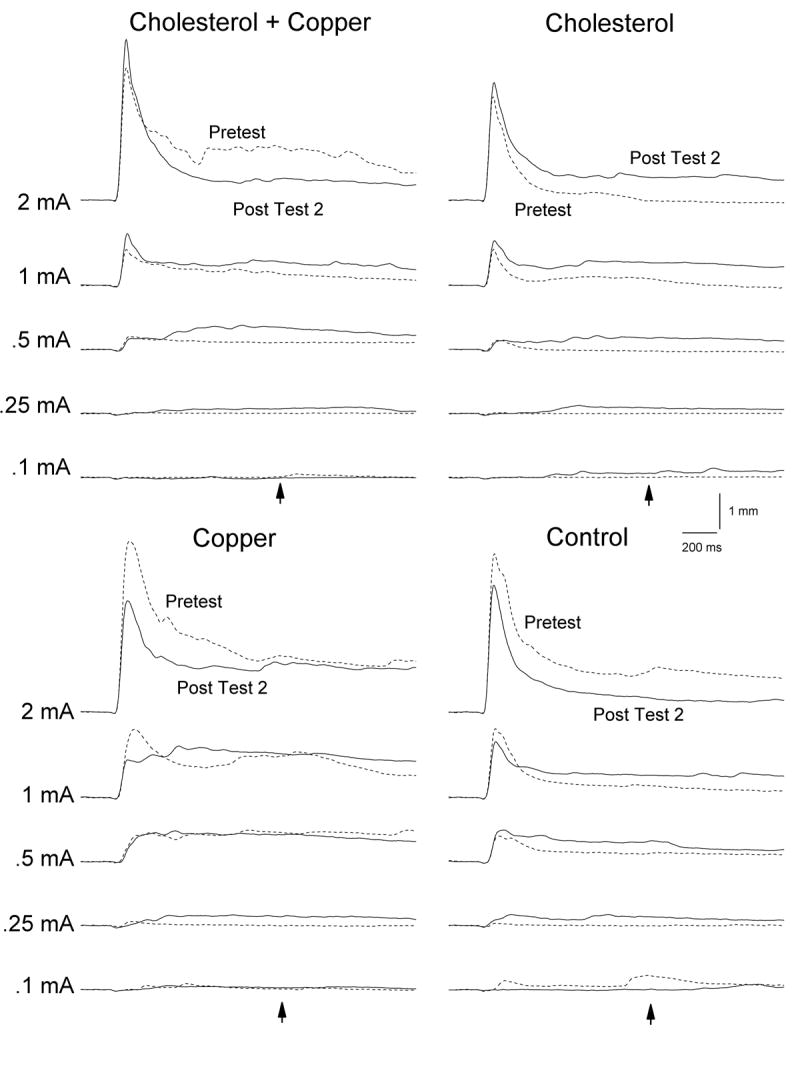
Average nictitating membrane response (NMR) topographies for the cholesterol + copper, cholesterol, copper and control groups on the first 20 trials of Pretest and on the first 20 trials of Post Test 2 across five unconditioned stimulus (US) intensities collapsed across US duration. The point in time when the US would have occurred had the US-alone test trial been a paired trial (1,000 ms from stimulus onset) is shown by the arrows. Nictitating membrane responding was recorded over a 2,000-ms interval comprised of a 200-ms pre-stimulus baseline and a 1,800-ms interval after US-onset.