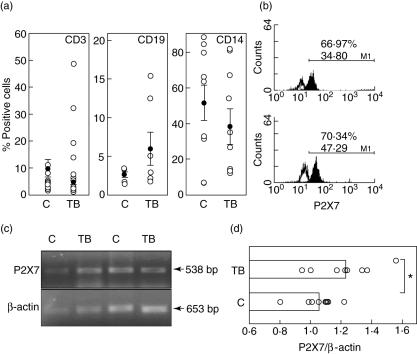
Fig. 1.
Expression of P2X7 in peripheral blood mononuclear cells from tuberculosis patients (TB) and healthy contacts (C). (a) Cells were immunostained for P2X7 and then for CD3, CD19 or CD14 and analysed by flow cytometry, as stated in Materials and methods. The arithmetic mean and s.d. of the percentage of positive cells are indicated. (b) Representative flow cytometry histograms of P2X7 expression in monocytes from a control (upper panel) and a TB patient (lower panel). Upper numbers correspond to the percentage of positive cells, and lower numbers to the mean fluorescence intensity. (c) Total mRNA isolated from peripheral blood mononuclear cells (PBMC) was reverse-transcribed to cDNA, and amplified by polymerase chain reaction using primers specific for P2X7 and β-actin. (d) Levels of P2X7 mRNA in PBMC from nine tuberculosis patients and nine healthy contacts. Data correspond to the arithmetic mean and s.e. of the densitometry values referred to β-actin signal (1·0). *P < 0·05.

