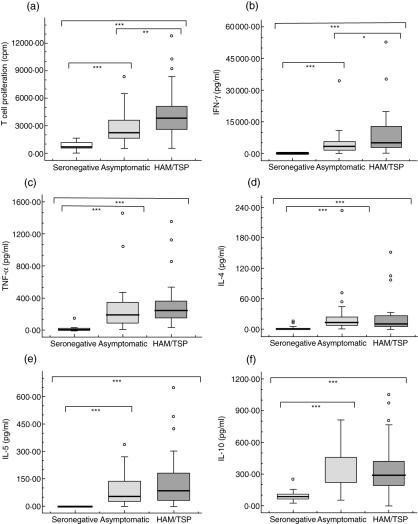
Fig. 1.
Ex vivo immune markers. Data represents spontaneous T cell proliferation expressed as counts per minute (cpm) and spontaneous cytokine production (pg/ml) in non-stimulated peripheral blood mononuclear cells (PBMCs), cultured for 72 h. Groups included human T-lymphotropic virus type 1 (HTLV-1)-associated myelopathy/tropical spastic paraparesis (HAM/TSP) patients, asymptomatic HTLV-1 carriers and HTLV-1-seronegative controls. The Mann–Whitney U-test was used to evaluate differences among groups. Only significant differences are shown with: *P < 0·05, **P < 0·005, ***P < 0·001.

