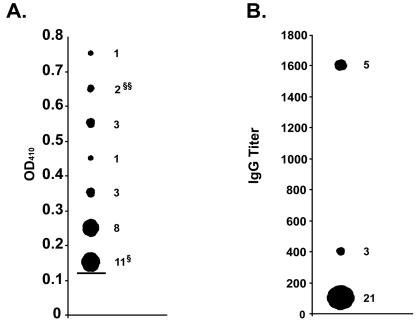
Figure 3. Marburg antibody testing in bats collected at locations where PCR positive bats were found.
A.) Corrected OD values from bat sera diluted 1∶100 that are greater than the threshold value of 0.13 (solid horizontal bar) which was calculated as the average corrected OD of the negative control group (E. franqueti, N = 47) plus 3 standard deviations. The numbers of sera specimens used to calculate the values are shown to the right of the corresponding symbol. OD values from nested-PCR positive bats 1448, 2296 (§§) and 1631 (§) are also noted. B.) Antibody titers of sera specimens with corrected OD values greater than 0.13. The numbers of serum specimens used to calculate the values are shown to the right of the corresponding symbol.

