
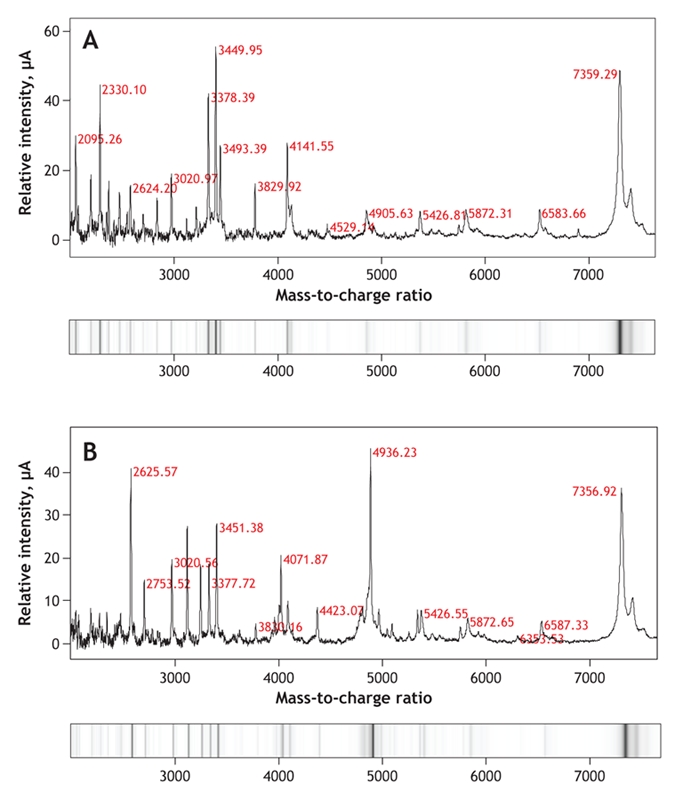
Figure 2: Spectra and virtual gels generated by surface-enhanced laser desorption and ionization, followed by time-of-flight mass spectrometry of urine samples from a healthy subject (A) and a patient with glomerular disease (B). Mass-to-charge values for selected peptides and proteins are shown in red. Some proteins and peptides are present in the urine of both subjects (e.g., mass-to-charge ratios 7359.29 and 7356.92, 5426.81 and 5426.55, and 2624.20 and 2625.57). Other proteins are apparent only in the urine of the patient with glomerular disease (e.g., mass-to-charge ratio 4936.23).