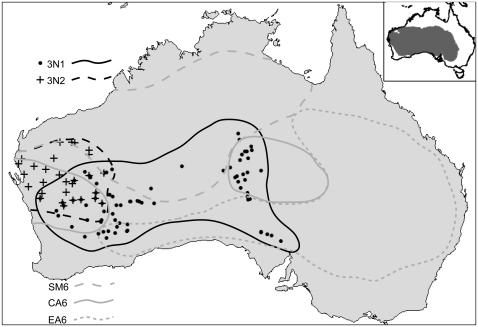
Figure 6. Sampling localities for the 3N1 and 3N2 mitochondrial clones.
Latitude/longitude data and sample sizes are given in Table 5. Ranges of the CA6, EA6, and SM6 sexual chromosome races are shown in light gray. The inset in the upper right shows the extent of the arid zone in dark gray.

