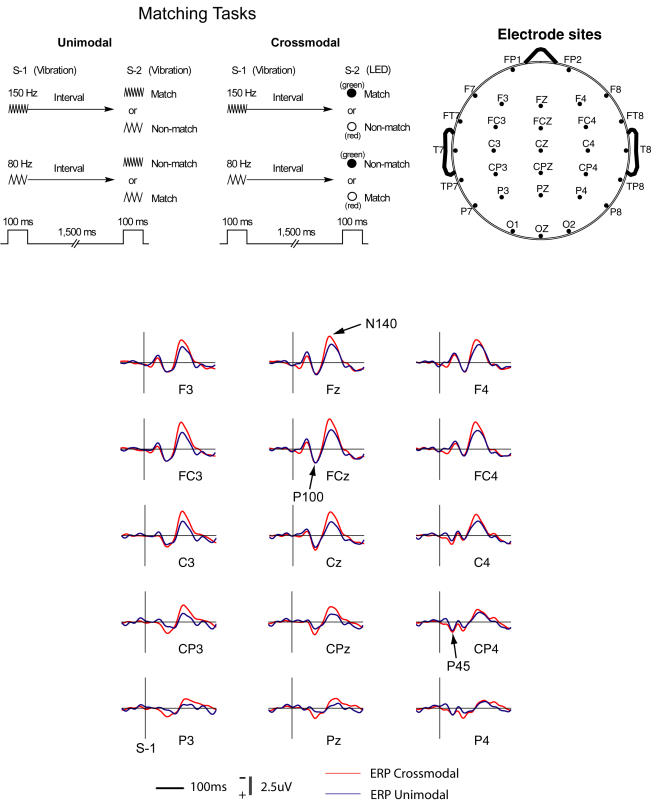
Figure 1. Tasks and scalp electrode distributions.
Upper-left: Schematic description of delayed matching-to-sample tasks. In the unimodal matching task, stimulus-1 (S-1) is a tactile vibration (150 Hz or 80 Hz) delivered on the subject's left index fingertip. Stimulus-2 (S-2) is also a tactile vibration. In the crossmodal matching task, S-2 is a light (red or green) from a light-emitting diode (LED) presented in front of the subject at eye level. The green light matches high frequency and the red light, low frequency. Upper-right: a top view of scalp electrode distributions. Nose and ears are shown in the diagram. Ag-AgCl electrodes are in a standard arrangement for locations. Lower: Grand average ERPs recorded in performance of the matching tasks. ERP components P45, P100, and N140 are indicated by arrows. The ERPs are time-locked to the onset of stimulus-1 (S-1).

