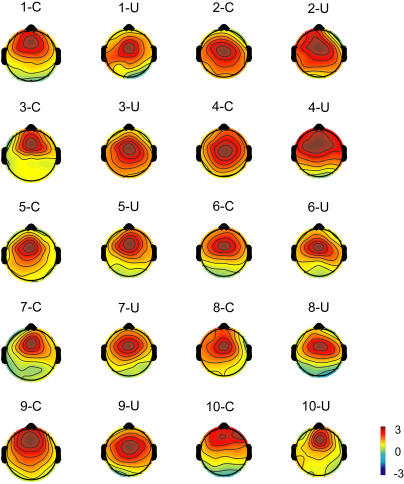
Figure 2. Topographic maps of an independent component (IC-F) located in frontal areas.
Color-scale shows the value of the projection coefficient of the component. The topography of the IC-F is consistent across subjects (n = 10, indicated by numbers) and between tasks, unimodal (U) and crossmodal (C).

