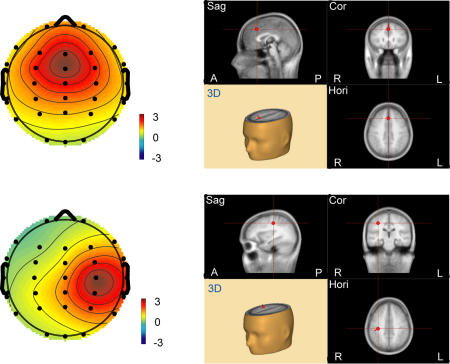
Figure 4. The average topography of IC-F (upper-left) and IC-RS (lower-left), and the corresponding BESA fitting dipole positions.
The grand mean of the topographic maps is from 10 subjects across the tasks. Dipoles indicating the source of the components are located in medial prefrontal areas (IC-F, upper-right) and somatosensory areas (IC-RS, lower-right) respectively. Image views of the brain for each component are (clockwise from the top-left): sagittal (Sag), coronal (Cor), horizontal (Hori), and three-dimensional (3D). A: anterior; P: posterior; L: left; R: right.

