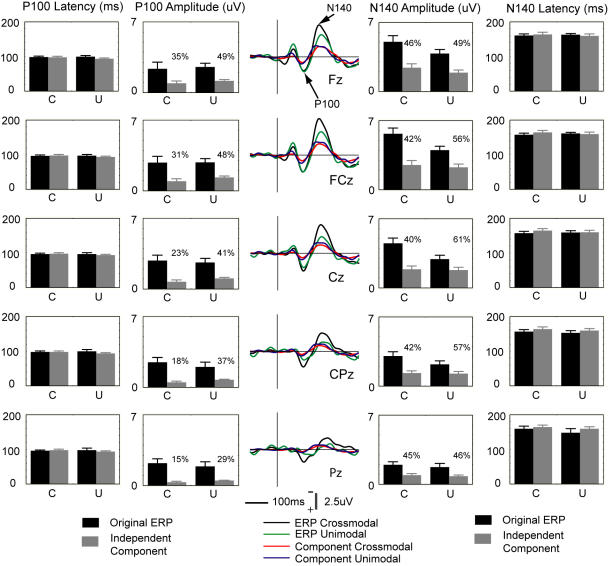
Figure 5. Comparisons of ERP components and IC projections.
Left: Comparisons of latency and amplitude of ERP component P100 and IC-F projections. Middle: Grand averages of the original ERPs recorded from those midline electrodes, and grand average back-projections of the IC-F component to those electrodes. Right: Comparisons of latency and amplitude of ERP component N140 and IC-F projections. The percentage number indicates the proportion of potential that the IC-F contributes to the original ERP N140. C: crossmodal. U: unimodal. In bar graphs, the range of the ordinate for latency of P100 and N140 is 0–200 ms; the range of the ordinate for absolute values of amplitude of P100 and N140 is 0–7 uV. Error bars represent SEMs in this figure and other figures.

