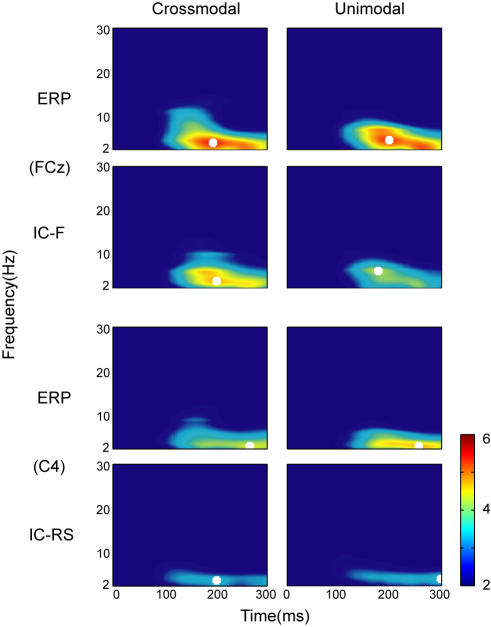
Figure 8. Time-frequency representation (TFR) for IC-F and the original ERPs at FCz (upper), and for IC-RS and the original ERPs at C4 (lower).
Results are the average of all trials over 10 subjects and displayed in units of standard deviation of the baseline. Time zero is the onset of stimulus-1 in the tasks, crossmodal and unimodal. The peak frequency is indicated by a white square in each corresponding representation.

