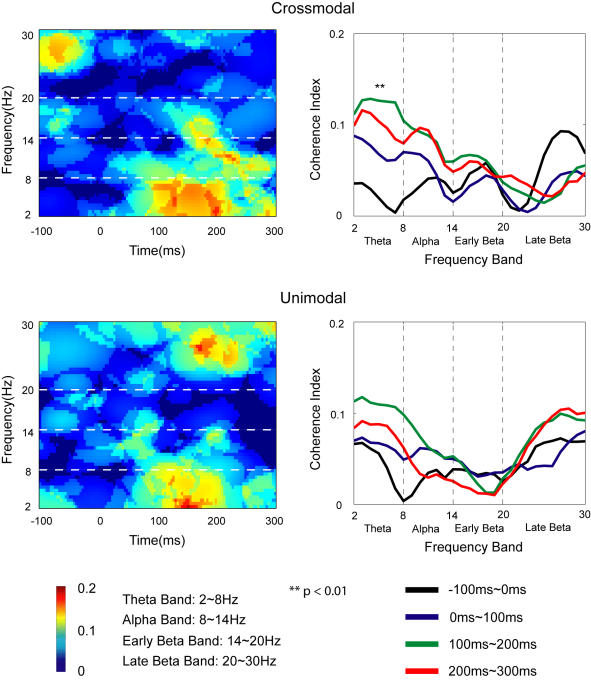
Figure 9. Average coherence between IC-F and IC-RS across subjects.
Upper: Results in the crossmodal task; Lower: Results in the unimodal task. Time-frequency representation of coherence index is shown on the left side for both tasks. The coherence index across different frequency bands during different time durations is shown on the right side for the tasks. Post hoc (Tukey HSD) test shows that the theta-band coherence during 100∼200 ms is significantly different from the baseline (−100∼0 ms) in the crossmodal task.

