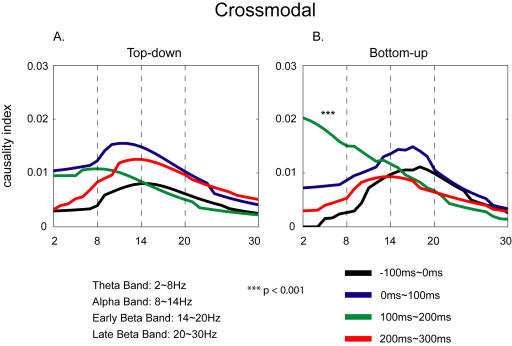
Figure 10. Granger causality analysis between IC-F and IC-RS for the crossmodal task.
Post hoc (Tukey HSD) test shows that in the theta band the bottom-up connectivity in the period of 100∼200 ms is significantly stronger than that in the baseline (−100∼0 ms). Top-down: Granger causality from IC-F to IC-RS; Bottom-up: Granger causality from IC-RS to IC-F.

