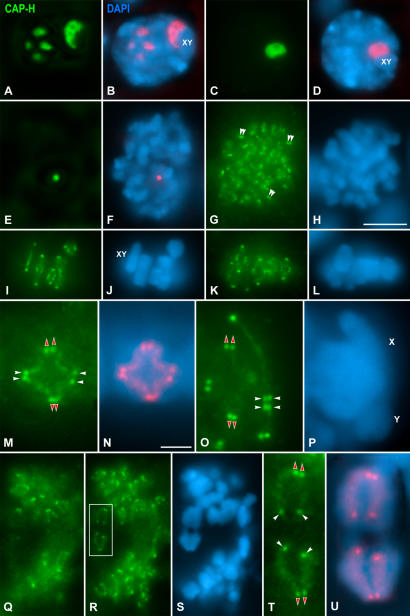
Figure 2. CAP-H distribution in meiosis I spermatocytes.
Mouse spermatocytes were stained for CAP-H (green) and counterstained with DAPI (blue). (A, B) In pachytene spermatocytes, CAP-H is detected in nucleoli lying in the nucleoplasm and associated to the sex body (XY). (C, D) Diplotene spermatocytes exhibit a CAP-H accumulation in the nucleolus associated to the sex body (XY). (E, F) In diakinesis, CAP-H is detected in a nucleolar remnant in the nucleoplasm. (G, H) In prometaphase I spermatocytes, a faint CAP-H labeling is observed along bivalents, and pairs of bright dots (double arrowheads) at chromosome ends. (I–L) Two focal planes throughout a metaphase I spermatocyte. The autosomal and sex (XY) bivalents show pairs of bright CAP-H spots at their centromeric and distal ends. (M–P) Selected autosomal and sex (XY) metaphase I bivalents. Four pairs of bright CAP-H spots are detected in each bivalent, one pair at each centromeric chromosome end (red arrowheads), and one pair at each distal chromosome end (white arrowheads). In (M) a diffuse CAP-H axis is observed inside each chromatid between the proximal and distal spots. (Q-S) Two focal planes of an anaphase I spermatocyte. (T, U) Segregating half-bivalents boxed in (R). In each chromosome, a pair of CAP-H dots is detected at the centromere region (red arrowheads), one spot at the distal end of each chromatid (white arrowheads), and a diffuse axial labeling along chromatids. In (B), (D), (F), (N) and (U) the CAP-H staining has been pseudocolored in red and superimposed on its corresponding DAPI image. Bars: (A–L, Q–S) 5 µm; (M–P, T and U) 3 µm.

