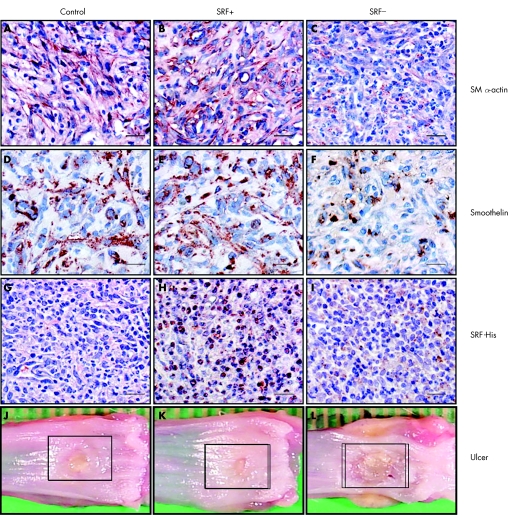
Figure 2 Immunohistochemistry and macroscopic appearances of oesophageal ulcers 6 days after serum response factor (SRF) gene therapy. Scale bar, 100 μm. (A–C) Granulation tissues stained with the antibody against smooth muscle (SM) α‐actin showing an increase in the number of SM α‐actin expression cells due to local upregulation of SRF (SRF+) and a decrease due to local knockdown of SRF (SRF−). (D–F) Granulation tissues stained with the antibody against smoothelin showing an increase in the number of smooth muscle cells due to local upregulation of SRF (SRF+) and a decrease due to local knockdown of SRF (SRF−). (G–I) Granulation tissues stained with the antibody recognising His tag showing specific nuclear staining in the rats that received SRF+ plasmid injection. (J–L) Macroscopic pictures of dissected oesophagus showing reduced ulcer size by local upregulation of SRF (SRF+) and delayed healing due to SRF deficiency (SRF−).

An official website of the United States government
Here's how you know
Official websites use .gov
A
.gov website belongs to an official
government organization in the United States.
Secure .gov websites use HTTPS
A lock (
) or https:// means you've safely
connected to the .gov website. Share sensitive
information only on official, secure websites.
