
Figure 2.
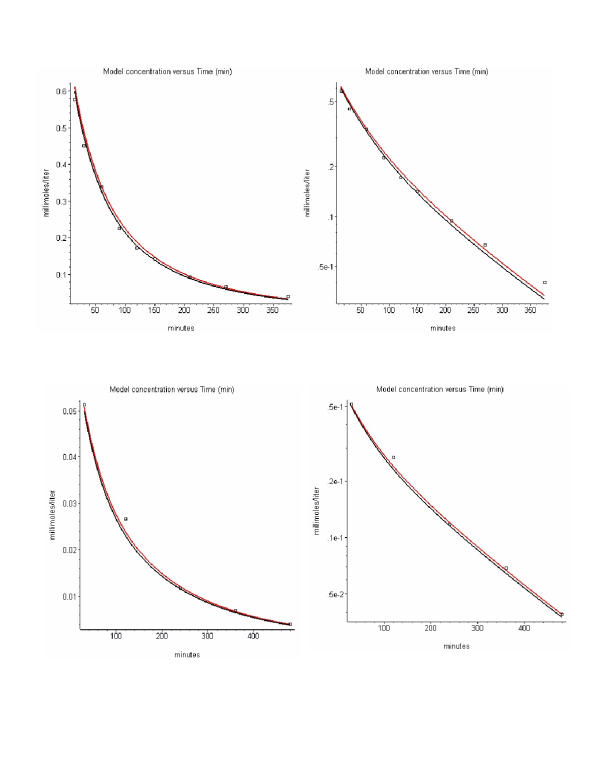
Comparison of PBPK model predictions and experimental data for mannitol plotted using linear (left) or semi-log (right). The predictions for the experimental data of Laker et. al. [57] (top) and Elia et. al. [58] (bottom) are shown using the parameters in Table 6. Both the model arterial (black) and antecubital vein (red) concentration curves are shown.