Figure 2.

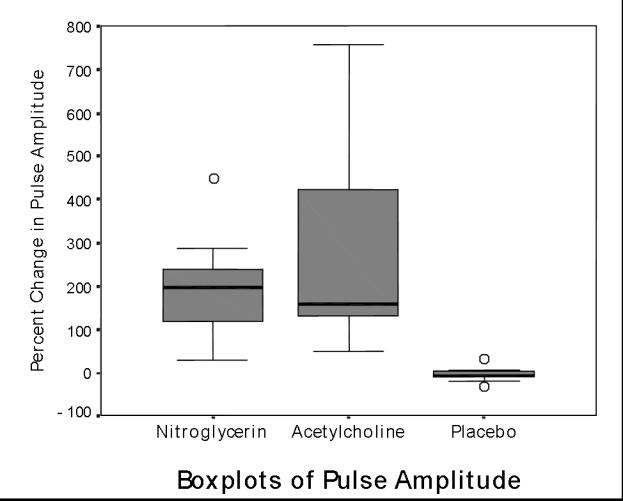
Boxplots of percent change in pulse amplitude at sites of nitroglycerin, acetylcholine, and placebo patches. (See Figure 1 legend). Both drugs vs. placebo: p = .005.

Boxplots of percent change in pulse amplitude at sites of nitroglycerin, acetylcholine, and placebo patches. (See Figure 1 legend). Both drugs vs. placebo: p = .005.