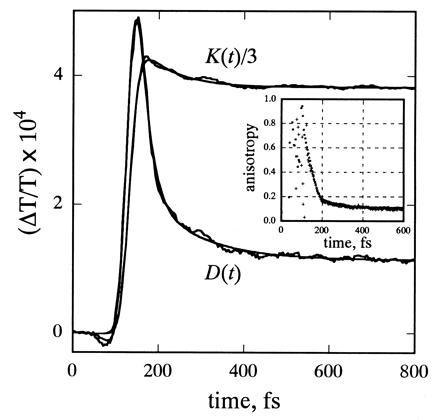
Figure 4.

Magic-angle K(t) and difference polarization D(t) decay curves calculated from the signals measured with parallel and orthogonal polarization at 860 nm, and fits to these curves (see text). The best fit to D(t) is obtained with r(t) = 0.745 exp(−t/21.8) + 0.095 exp(−t/135) + 0.099. (Inset) The “raw” anisotropy [D(t)/K(t)] calculated from the wavelength-resolved signals at 860 nm (∗) and from signals measured without the monochromator in the probe beam (+).
