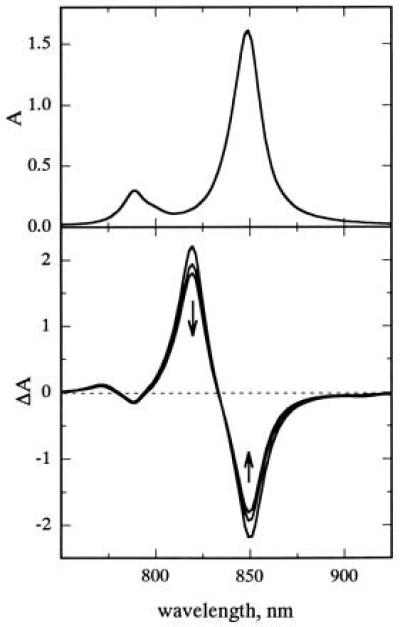
Figure 5.

(Upper) Calculated absorption spectrum of the B850 LH2 complex based on the Rp. acidophila crystal structure. To calculate the lineshapes, three vibronic modes were used with the following frequencies (ω) and Huang–Rhys factors (S): ω1 = 20 cm−1, S1 = 1.0, ω2 = 200 cm−1, S2 = 0.02, ω3 = 750 cm−1, S3 = 0.05. The linewidths of the vibronic transitions were Γk=0 = 60 cm−1 and Γk≠0 = 270 cm−1. (Lower) Time-resolved difference spectra calculated using the same vibronic parameters as above, including bleaching of the ground-state absorption, stimulated emission, and excited-state absorption. The Γ values for ground-state absorbance and stimulated emission also were as above; the excited-state absorption linewidths were all assumed to be 270 cm−1. The arrows point in the direction of thermalization at room temperature.
