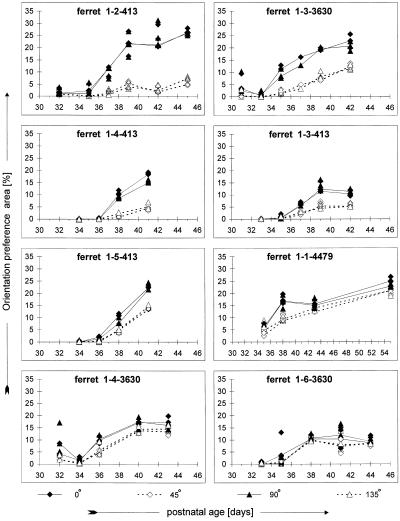
Figure 3.
Quantification of orientation preference areas. Orientation-specific response areas were calculated in each animal at each age as described in Materials and Methods. Values calculated for blocks of data from individual trials are shown to provide information on the noise in the measurement; combined data for all trials at a given orientation in a given animal at a given age are indicated by the symbols connected by lines. In all eight animals studied, horizontal and vertical response areas are significantly larger than oblique response areas (two-factor ANOVA, P < 0.01 for ferret 1-6-3630; P < 0.001 for all other animals). However, the magnitude of the anisotropy varies between animals. Note that ferrets 1-2-413 through 1-5-413 were littermates, as were ferrets 1-3-3630, 1-4-3630, and 1-6-3630. Ferrets 1-4-413 and 1-4-3630 were females.

