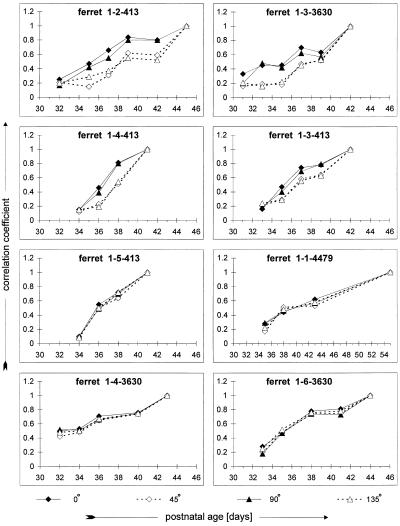
Figure 4.
Cross-correlation analysis of map maturation. Correlation coefficients indicate the similarity between each developing map and the most mature map recorded for that orientation in that animal. Larger correlation coefficients indicate a more mature map (note that in all animals at the oldest age the mature map is correlated with itself, necessitating a coefficient of 1). Panels present data from the same animals illustrated in Fig. 3, presented in the same order. The animals illustrated in the upper four panels show faster development of horizontal and vertical preferences, whereas those in the lower four show parallel development of all orientations.

