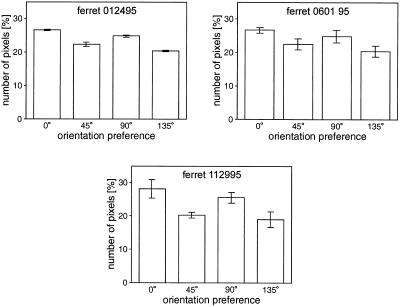
Figure 5.
Orientation preference areas in adult ferrets. The three panels show the orientation preference areas calculated for three adult animals. Error bars indicate the standard deviation of values calculated from individual trials. In each of these adults the cortical area devoted to horizontal and vertical stimuli was significantly larger than that devoted to the obliques (one-tailed t test, P < 0.001 for each animal).

