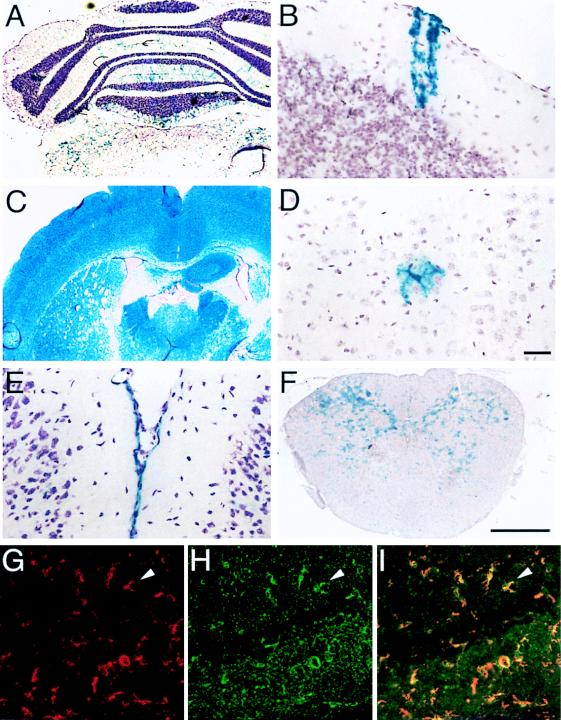
Figure 3.
Transgenic lines show expression in glial and pial cells. All sections are coronal. (A–F) X-Gal-reacted tissue counterstained with hematoxylin. (A) MACZ 9/1 cerebellum (×25). Staining is present in Bergmann glia, but absent in Purkinje cells. (B) Bergmann glial cell in cerebellar cortex (×400). (C) MACZ 9/2 cerebral cortex and hippocampus (×25). (D) MACZ9/3 cortical astrocyte (×400). (E) MACZ2Δ9 pial cells (×400). (F) Stained astrocytes in spinal cord gray matter of MACZ9/1 mouse (×25). (G–I) Hippocampal section of MACZ9/2 brain treated with both anti-β-galactosidase and anti-GFAP primary antibodies (×400). Arrowhead indicates same cell in each panel. (G) Anti-GFAP, visualized by Texas red-conjugated secondary antibody. (H) Anti-β-galactosidase staining visualized by fluorescein isothiocyanate-conjugated secondary antibody. (I) Double-exposure. [Bars = 25 μm (F) and 500 μm (H).]

