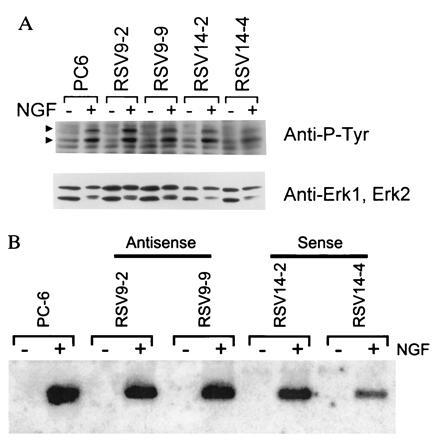
Figure 4.

(A) NGF-mediated protein tyrosine phosphorylation. Cells were treated for 5 min with 100 ng/ml 2.5S murine NGF or vehicle (PBS), lysed, resolved on a 10% polyacrylamide gel, transferred to a nitrocellulose membrane, and probed with an antiphosphotyrosine antibody (RC20). The NGF-induced P-Tyr containing bands indicated by arrowheads correspond to erk1 (upper arrowhead) and erk2 (lower arrowhead) based on relative molecular weights and reprobing with erk1- and 2-specific antibodies (Lower). (B) NGF-mediated NGFI-A gene induction. Cells were treated with 100 ng/ml 2.5S murine NGF or vehicle (PBS) for 1 hr. The RNA was harvested, resolved on a formaldehyde agarose gel, blotted to a nitrocellulose membrane, and probed with a radiolabeled NGFI-A cDNA. An apparent decrease in material going from left to right on the autoradiogram is actually due to uneven transfer of the gel as can be judged by a concomitant decrease in background signal. The efficiency of transfer does not affect the conclusions drawn from the data.
