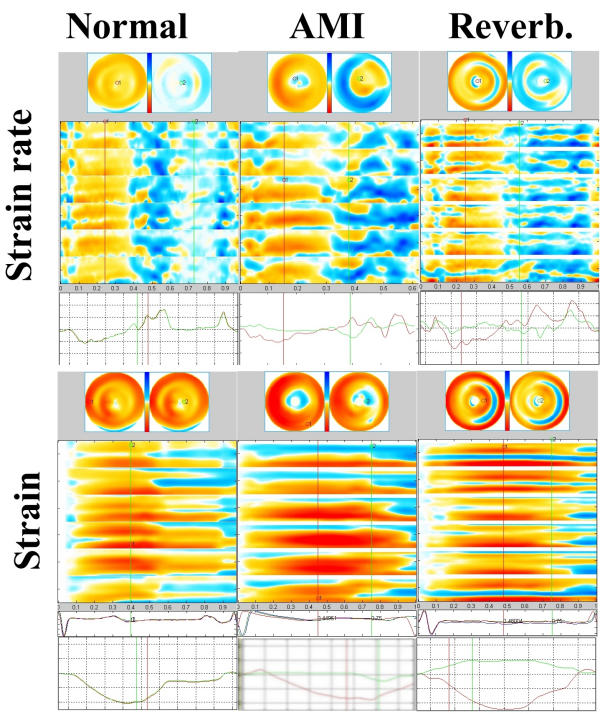
Figure 5.
The appearance of reverberations versus normal and pathological findings. Left to right: normal subject with good quality images (control 1), patient with anteroapical infarction (patient 6) and normal subject with poor image quality (control 4). Top to bottom: Strain rate bull's eyes, M-mode arrays and curves, Strain bull's eyes M-mode arrays, ECG and curves. The red colour of strain is seen to extend well into diastole normally, so post systolic shortening in pathology cannot be discerned by colour strain images. In the infarct, apical hypo- to akinesia is visible in all modalities, and post systolic shortening in colour strain rate and both strain rate and strain curves. Reverberations are seen as midwall circular lines of inverted colour in the bull's eye, and as horizontal lines of inverted colour in the M-modes. In strain rate curve it may give the impression of akinesia with post-systolic shortening (although not quite typical), but the horizontal lines of reverberations in M-mode array is typical. In strain, findings are typical reverberations, also in the curve.

