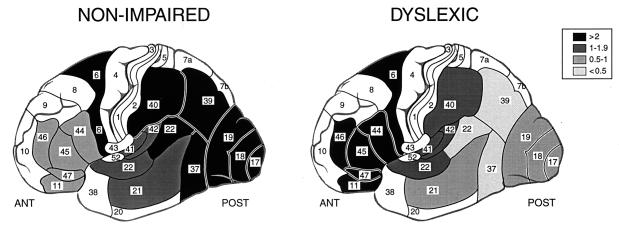
Figure 3.
Relative increase in activation during phonologic compared with orthographic coding in different brain regions in NI and DYS readers. As shown in the key, the shadings represent the relative magnitude of the increase in activation (mean pixel counts) for a given ROI calculated as: (NWR − C/C) = R. In posterior regions [e.g., posterior BA 22 (STG) and BA 39 (angular gyrus)], the relative change in activation is large (>2, shown in black) in NI readers but very small in DYS readers (<0.5, shown as lightest gray). A contrasting pattern is shown in anterior regions, for example, in BA 44 and 45 (IFG), where NI readers demonstrate an increase in activation (0.5–1) and DYS readers demonstrate an even greater increase (>2). There are regions where NI and DYS readers show similar increases in activation, for example, BA 6 and anterior STG (BA 41, BA 42, anterior BA 22). Brain regions shown in white were not part of the 17 ROIs examined; numbers represent BAs.

