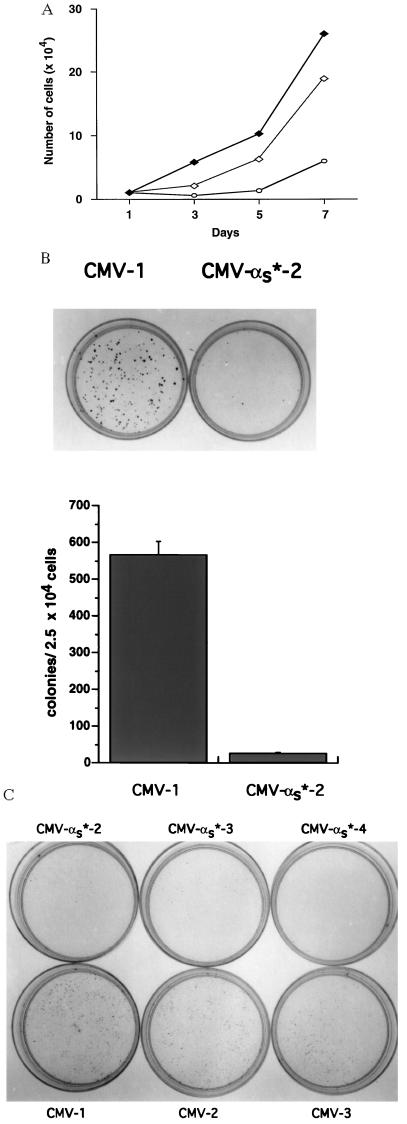
Figure 3.
Effect of αs* expression on proliferation and soft agar colony formation by MCF-7 cells. (A) Wild-type (⧫), vectortransfected (◊), and αs*-expressing cells (○) were grown for 7 days. Cells were counted in duplicate every other day. Values are average of duplicate determinations, which were within 10%. (B) Cells were seeded and colony formation was assayed as described in Material and Methods. Four plates for the vector-transfected cell line and the αs*-expressing cell line were counted. Values are mean ± SD. Pictures of a typical vector-transfected cell line and αs*-expressing cell line are shown. (C) Three different vector-transfected and αs*-expressing cell lines were compared for ability to form colonies in soft agar. Plating was carried out in triplicate. A typical plate for each condition is shown.

