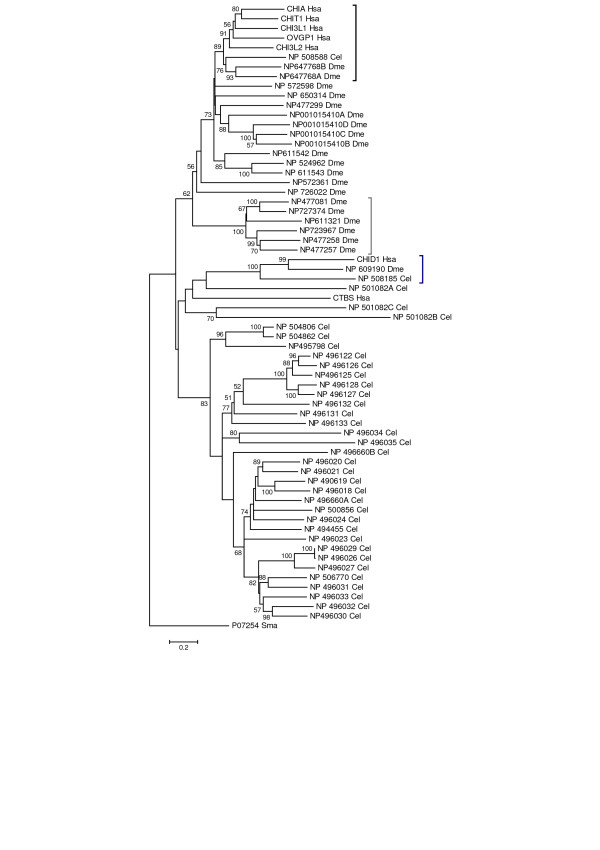
Figure 3.
Phylogenetic analysis of GH18 domains of chitinase/chitolectins from human, D. melanogaster and C. elegans. The figure shows a minimum evolution tree from a phylogenetic analysis conducted as described in the legend for Figure 1. Binomen abbreviations are used for species, gene symbols for human proteins, and accession numbers for D. melanogaster and C. elegans proteins. A black bracket at the right indicates the clade encompassing all the human chitinases/chitolectins, two domains from a single protein of D. melanogaster, and a single protein of C. elegans; a dark gray bracket indicates the clade encompassing the D. melanogaster imaginal disc growth factors (chitolectins); and a dark blue bracket the stabilin-1 interacting chitolectin group. Scale, bootstrapping and rooting are as described for Figure 1. Bootstrap values ≥ 50% are shown.

