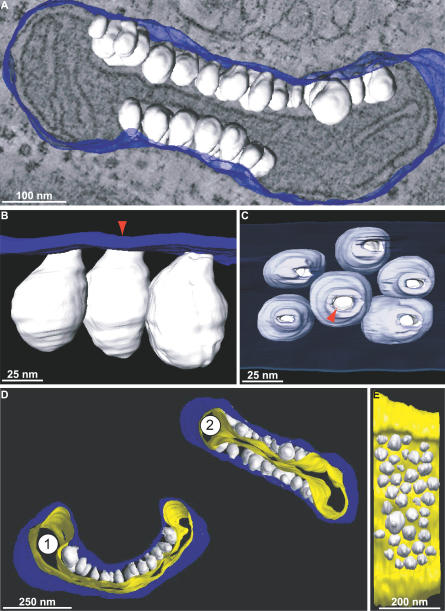
Figure 4. 3-D Maps of FHV-Modified Mitochondria.
Blue indicates outer mitochondrial membrane, white indicates FHV spherules, yellow indicates inner mitochondrial membrane.
(A) Merged image of a 3-D map of the outer membrane and spherules of the mitochondrion from Figure 3A and 3B and a slice of the tomogram showing the electron density map from which it was derived.
(B) A portion of the map in (A) showing a close-up view of the connections between the outer mitochondrial membrane and the spherules. The red arrow marks that same spherule as the one depicted by the red arrow in Figure 3A.
(C) A 90 ° rotation of (B) showing the channels that connect the spherule interiors to the cytoplasm. The outer membrane has been made translucent to show the spherules behind it. Again, the red arrow corresponds to the red arrows in Figures 3A and 4B.
(D) 3-D maps of the mitochondria shown in Figure 3C.
(E) A view of mitochondrion 2 from (D) that has been rotated and has had the outer membrane removed to show the range of spherule sizes.

