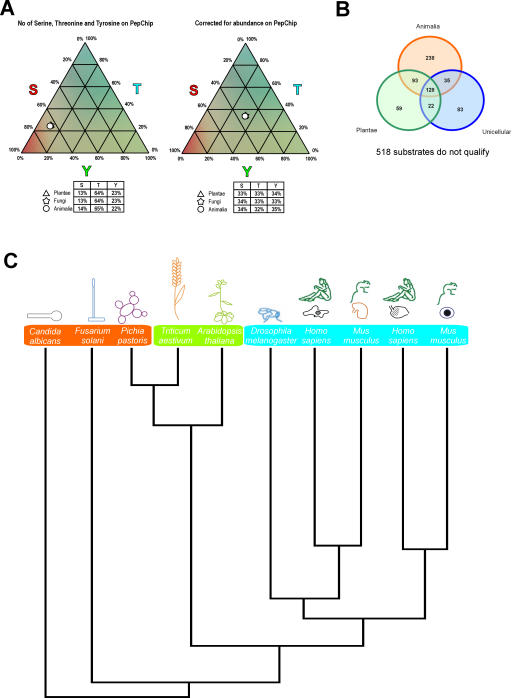
Figure 2. (A) Distribution of serine, threonine, and tyrosine substrates of the different phyla on the PepChip, before (left) and after (right) correction for the abundance of each phosphate acceptor on the PepChip.
(B) Venn diagram of spots phosphorylated by the different regna. (C) Hierarchical clustering (according to Johnson [29]) of the phosphorylated motifs among the lysates tested.

