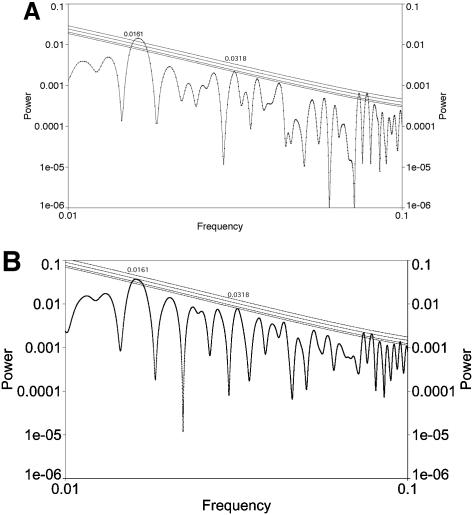
Figure 2. Analysis of fractional fossil biodiversity fluctuations with LS; analysis used AutoSignal and significance levels were computed assuming Gaussian fluctuations.
Lines denote 0.1, 0.05, 0.01, and 0.001 levels of significance. Frequencies are given per Myr. A. Analysis of data detrended using the cubic. There is a peak at a frequency of approximately 0.0161/Myr which is equivalent to 62.1±3.1 Myr; this peak is significant at better than the .001 level. There is also a peak at a frequency of approximately 0.0318/Myr which is equivalent to 31.4±0.9 Myr, although this peak is only significant at the .1 level. All other significant peaks occur at less than 15 Myr and thus are near or below the Nyquist frequency. B. Analysis of data divided by actual diversity in each interval. There is a peak at a frequency of approximately 0.0161/Myr which is equivalent to 62.1±3.3 Myr; this peak is significant at better than the .01 level. There is also a peak at a frequency of approximately 0.0318/Myr which is equivalent to 31.4±0.9 Myr, although this peak is not significant at the .1 level. All other significant peaks occur at less than 15 Myr and thus are near or below the Nyquist frequency.

