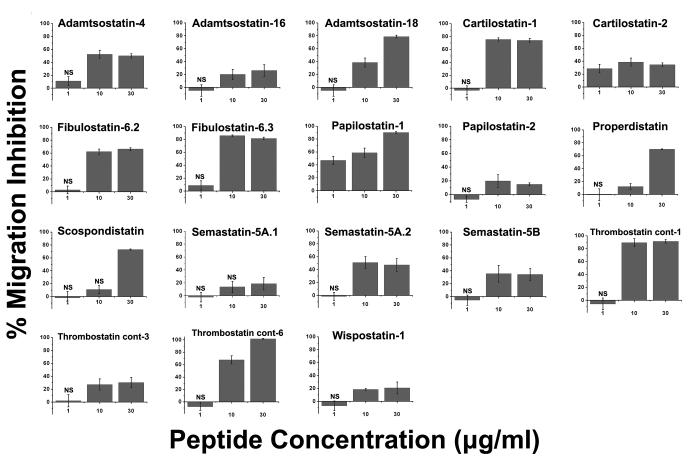
Figure 2.
Effect of the peptides on the migration of HUVECs in a modified Boyden chamber migration assay. Endothelial cells were allowed to migrate for 20 h in the presence of 20 ng/ml VEGF and 30 μg/ml peptide solution, then stained with calcein and counted. The fluorescent signal was initially scaled so that 0% represents the negative control (endothelial cells in serum- and growth factor-free medium) and 100% the positive control (migration in the presence of 20 ng/ml VEGF). Tthe percentage migration inhibition, shown in the figure, was calculated. Vertical bars indicate the standard error. All values are significantly different from 0% at p<0.001, except those marked by NS (non-significant). In all cases, the standard error for the controls was <5% (n=8).

