
Fig. 9.
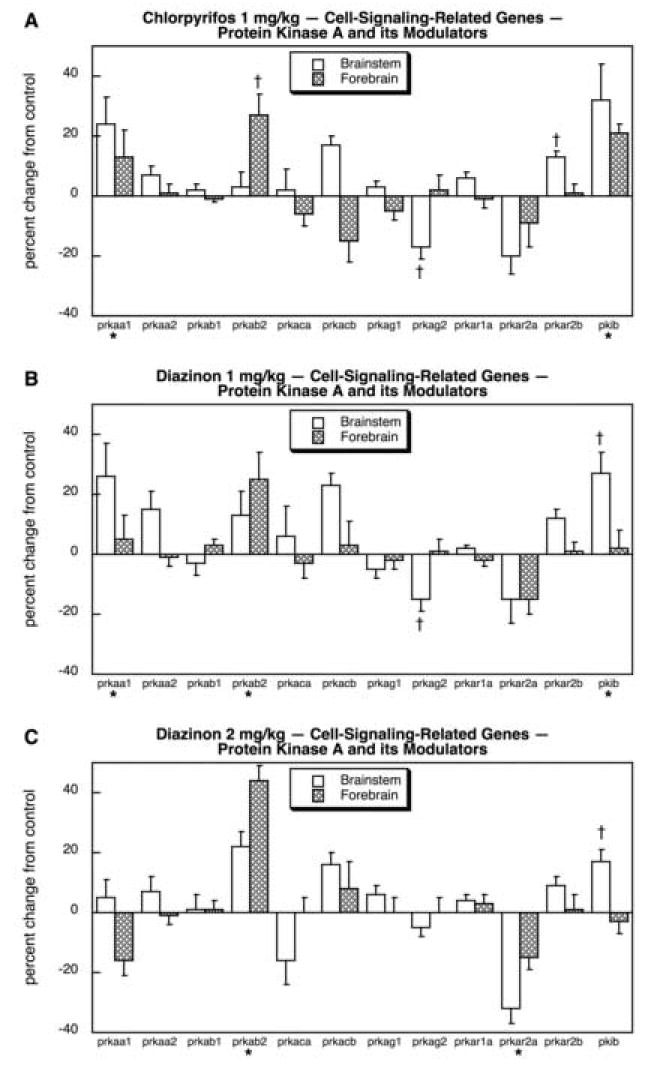
Effects of 1 mg/kg/day CPF (A), 1 mg/kg/day of DZN (B), or 2 mg/kg/day of DZN (C) on expression of the subset of cell signaling-related genes for protein kinase A subtypes and their modulators, presented as the percentage change from control values (Table 5). Asterisks shown below each gene denote a significant main treatment effect. Daggers denote genes for which a treatment × region interaction was detected and show the individual regions for which treatment effects were present. Multivariate ANOVA (all treatments, all genes, both regions) indicates an interaction of treatment × gene (p < 0.0001).