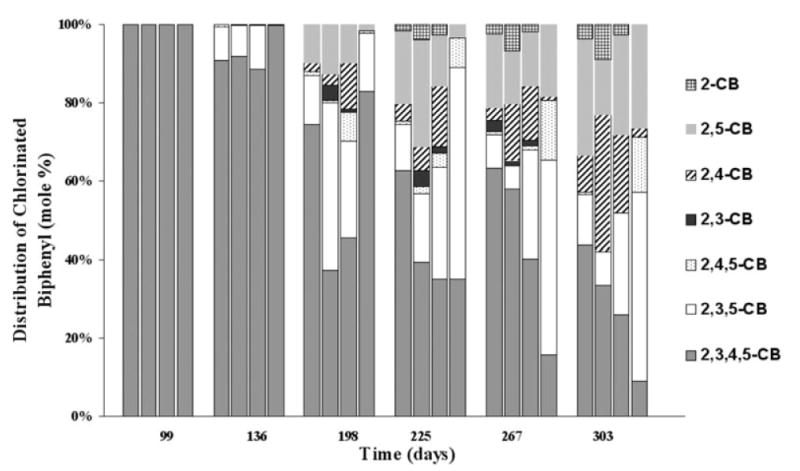
Fig. 2.

Molar distribution of 2,3,4,5-CB and its dechlorination products. For each four-column group at a certain time point, the first to fourth columns represent microcosms with 0, 100, 500 and 1000 mg l−1 bicarbonate added respectively. The molar percentages presented here are average values of the triplicate microcosms.
