
Figure 3.
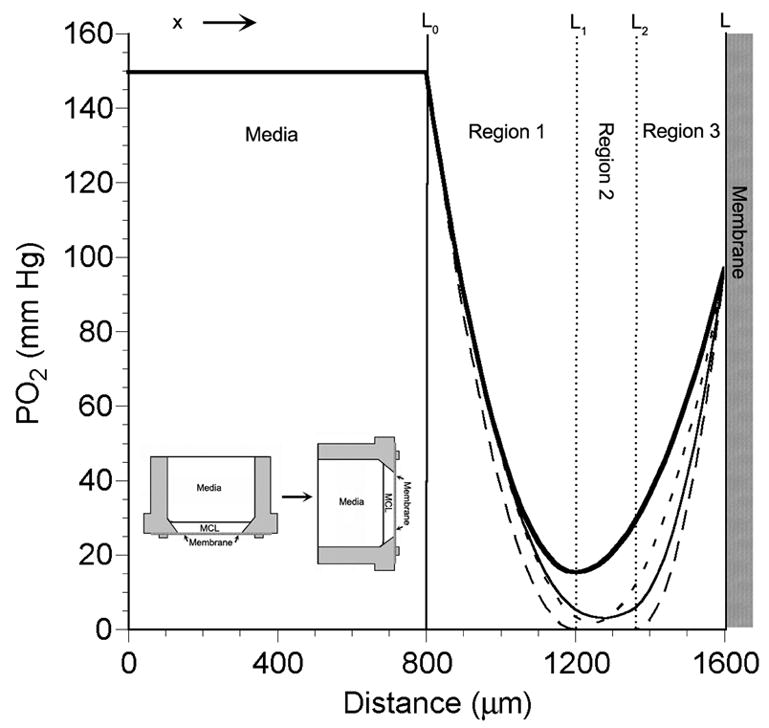
Schematic of the MCL within the tissue culture insert that has been rotated 90° counterclockwise (inset in lower left) to aid in visualization of the PO2 profiles. The curves within the MCL are theoretical PO2 profiles calculated using four models: 1-region model (short dashed line, ---), 2-region model (thick solid line, ━), general 3-region model (thin solid line, ——), and the modified 3-region model with a middle layer where PO2 = 0 (long dashed line, — —). The interface of the media and MCL at the top of the MCL in the measurement chamber is at x=L0. The MCL/membrane interface is located at x=L, which is at the bottom of the insert.