
Figure 7.
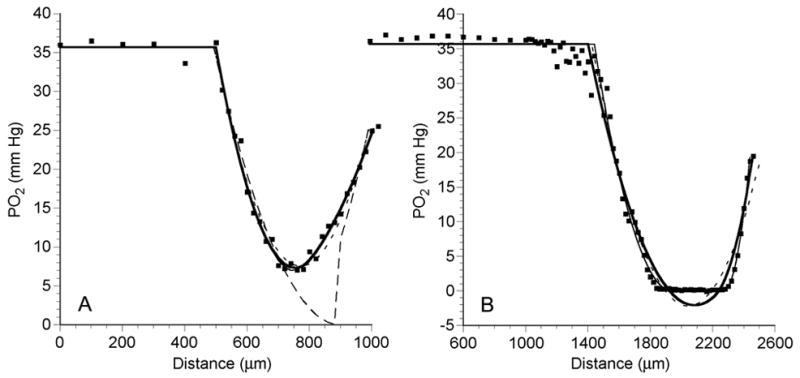
PO2 profiles (dots) across an OCM-1 MCL, while MCL was suspended in 5% O2-saturated RPMI, demonstrating a profile with no anoxia (A) and a profile with a significant anoxic region (B). The short dashed line (---) is the best fit of the data to the 1-region diffusion model. The thick solid line (—) and thin solid line (——) show the best fits of the 2-region and the general 3-region models, respectively. The long dashed line (— —) is the best fit to the modified 3-region model with a middle layer where PO2 = 0.