
Figure 8.
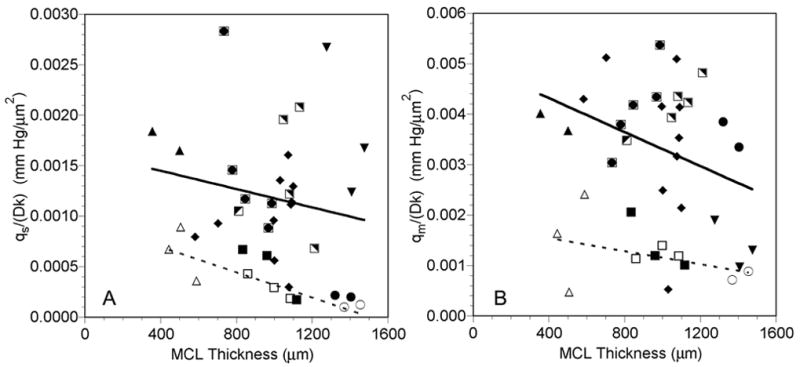
Oxygen consumption of tumor cells supplied from the free surface, qs/Dk (A), and of tumor cells supplied from the membrane surface, qm/Dk (B), as a function of MCL profile thickness while the MCL was suspended in air-saturated RPMI (closed and half-closed symbols, solid lines) or 5% O2-saturated RPMI (open symbols, dashed lines). Each symbol represents measurements made in the same MCL. The same open and closed symbols represent profiles measured in the same MCL under the different gas bubbling conditions. Lines are regression lines with L-L0 = measured profile MCL thickness:
Air: qs/Dk = −4.54x10⁻⁷(L-L0) + 1.63x10⁻³, r=−0.179, p=0.344, n=30
5% O2: qs/Dk = −6.28x10⁻⁷(L-L0) + 9.46x10⁻⁴, r=−0.869, p=0.005, n=8
Air: qm/Dk = −1.68x10⁻⁶(L-L0) + 4.99x10⁻³, r=−0.325, p=0.080, n=30
5% O2: qm/Dk = −6.46x10⁻⁷(L-L0) +1.80x10⁻³, r=−0.411, p=0.312, n=8