
Fig. 4.
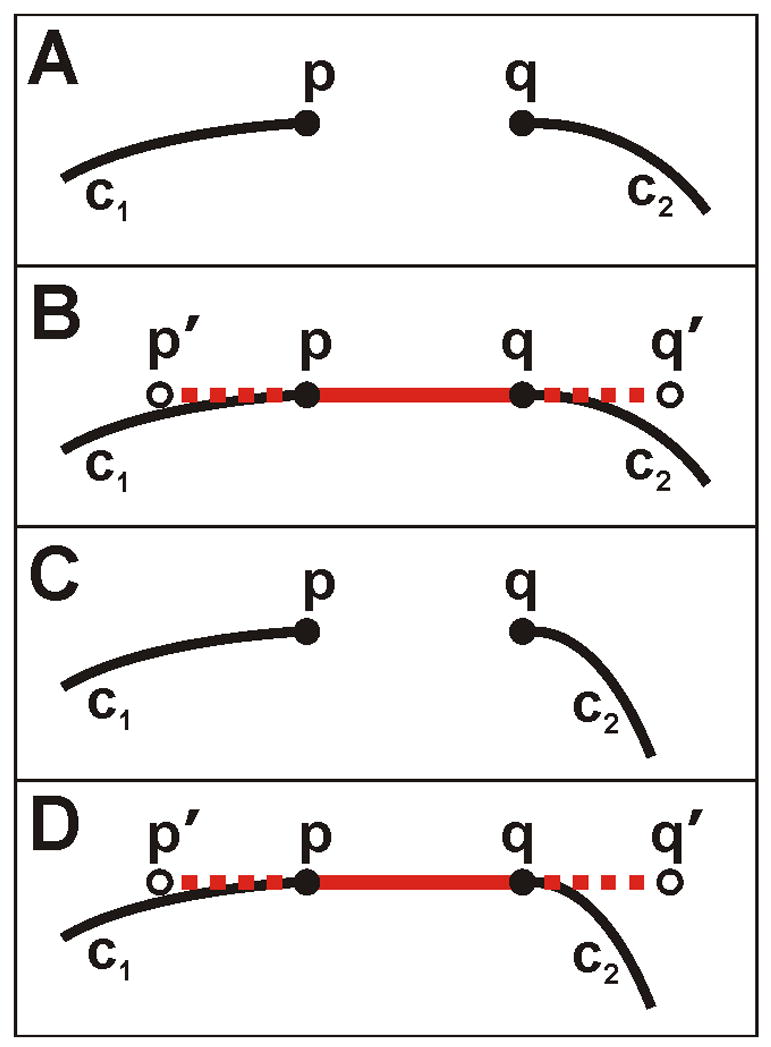
Diagramatic representation of NeuronMetric’s gap-filling method. Each panel shows two portions of curvilinear neurite skeleton, c1 and c2, with endpoints p and q, respectively. (A) A gap, for example within a neurite, that will be filled. (B) The solid red line segment drawn between p and q and the dashed-red extended line segment to endpoints p’ and q’. Because the distance between the line segment extensions and the nearby curves is less than some specified maximum deviation, the gap between c1 and c2 will be filled. (C–D) A gap, for example between two different neurites, that will not be filled because pixels on curve c2 fail the 'close to' test.