
Fig. 8.
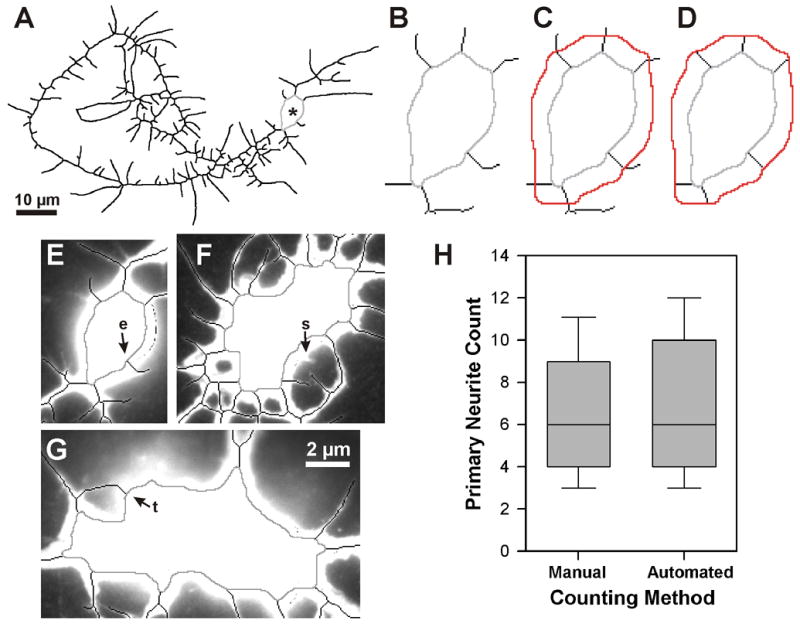
Primary neurite count. (A–D) Computing the root of each primary neurite. All or part of the skeletonized neurite arbor is shown inverted, with the cell body ROI in light gray. See Fig. 1A for original neuron image. (A) Final skeleton of neurite arbor, thickened to improve visibility. Asterisk marks the cell body. (B) Enlarged view of cell body ROI and the proximal portions of the primary neurites. (C) The expanded cell body ROI (red), as computed by NeuronMetrics and added to the image in (B). (D) NeuronMetrics has removed skeleton pixels distal to the expanded cell body ROI, leaving only the skeleton pixels that connect the two ROIs. The root of each primary neurite is found by traversing each skeleton fragment from the expanded cell body ROI to the first skeleton pixel that contacts the cell body ROI. (E–G) Assessment of primary neurite count. Three different neuron cell bodies, showing the cell body ROI (gray) and adjacent skeletonized neurites (black) superimposed on the corresponding fluorescent image. Skeleton has been eliminated from the cell body regions. The automated primary neurite counts vs. manual counts are 6 vs. 5 (E), 17 vs. 18 (F), and 11 vs. 10 (G). Errors in the automated counts, relative to human interpretation of the neuron, result from skeletonization error (see e in E) and a neurite tip touching the cell body (see t in G). In F, a very short neurite (see s), that did not meet the primary-neurite length threshold, had been counted manually. (H) Validation of primary neurite count. Comparison of manual and automated primary neurite counts performed on a set of 59 neurons (images are from the same experiment depicted in Fig. 8). Box-plot distributions with the median indicated by the line inside the box. Top and bottom of the box represent the 75th and 25th percentiles, respectively, and the upper and lower crossbars represent the 90th and 10th percentiles, respectively. The median values are identical and the Mann-Whitney rank sum test shows no statistically significant difference (P = 0.66).