
FIG. 2.
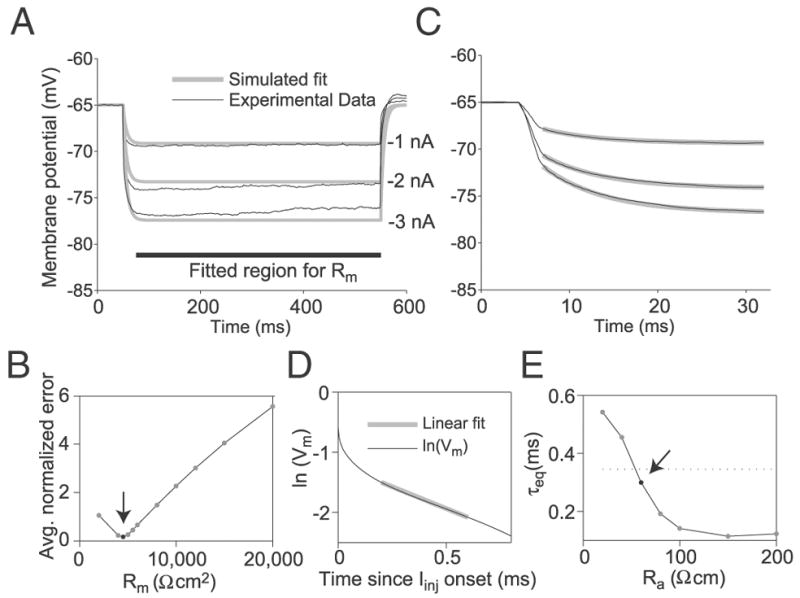
Determination of the LGMD specific membrane resistivity (Rm), specific capacitance (Cm), and axial resistance (Ra). A: Rm was obtained by fitting the steady-state membrane potential deflections to hyperpolarizing current pulses (−1, −2, and −3 nA) simulated in the compartmental model (gray lines) to those obtained experimentally (black lines; mean across 10 cells) (experimental data from Gabbiani and Krapp 2006). The fitted region (thick black bar) excluded transients during the initial 25 ms of the response. The gray curves represent the best fit obtained from the compartmental model, with Rm = 4,500 Ω · cm2, Cm = 1.5 μF/cm2, and Ra = 60 Ω · cm. These values were determined as illustrated in B–E. B: averaged, normalized error between steady-state experimental and simulated membrane potential as a function of membrane resistivity. The arrow indicates the optimum value (Rm = 4,500 Ω · cm2). Normalized error was measured for a given simulated current step by taking the squared area of the region between the simulated and experimental membrane potential traces and dividing by both the mean experimental membrane potential deflection and the duration of the fitting region (475 ms). Averaged, normalized error for a particular Rm consists of the average of normalized errors across all Cm, Ra, and current injection level values simulated with that Rm. C: determination of the specific membrane capacitance, Cm. The experimental membrane potential transients (black) were fitted with a single-exponential curve (gray) between 2 and 27 ms after current injection onset, yielding a time constant τm. The optimal τm was 6.6 ms. From τm = RmCm, we obtain Cm = 1.5 μF/cm2. D and E: determination of Ra. The compartmental model was used to simulate membrane potential responses to current pulses for a range of Ra values with Rm and Cm set to the values obtained above. The equalization time constant, τeq, was obtained from the simulated current injections by plotting the logarithm of the membrane potential minus the optimal fitting τm-based exponential as a function of time during the 1st 0.8 ms of the current pulse (D). A straight line was fit to the linear sub-region of this curve (gray line in D), from which τeq was derived (METHODS). E: simulated τeq illustrated as a function of Ra. The arrow indicates the point where this curve achieves the value closest to that derived from experimental data (mean τeq-experimental = 0.34 ms, dotted line; Ra = 60 Ω · cm).