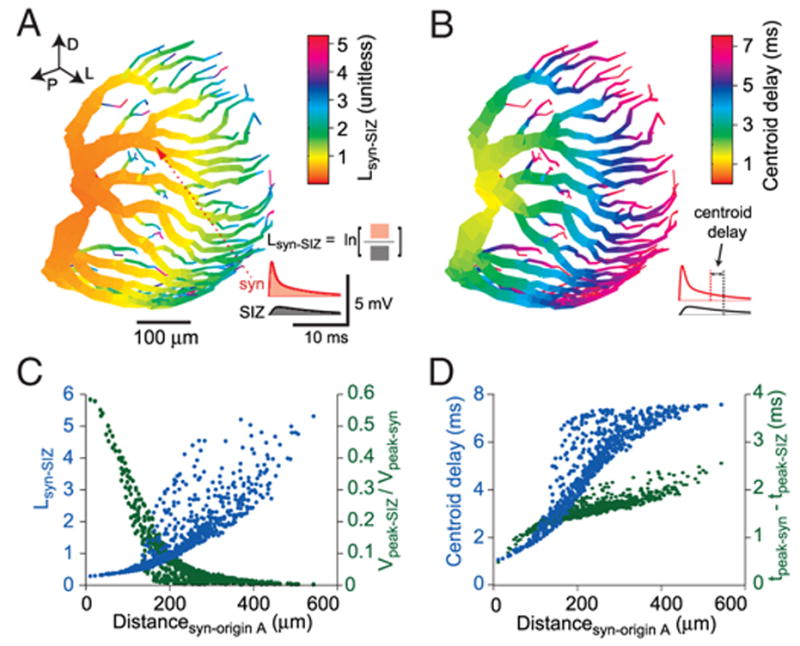
FIG. 3.

Electrotonic structure of LGMD’s dendritic field A. A: log-attenuation (Lsyn-SIZ) between the excitatory postsynaptic potential (EPSP) measured at the synapse and the same EPSP measured at the spike initiation zone (SIZ). The color code reflects the Lsyn-SIZ for a synapse placed at that particular spatial location. Lsyn-SIZ is equal to the logarithm of the ratio of the membrane potential integrals at the SIZ (inset, black curve) and at the synapse (red curve). The red arrowhead shows the location of the synapse used for the inset. Lsyn-SIZ is equivalent to the electrotonic distance for an infinite cylinder and a constant depolarization. The parameters of the alpha synapse wereτsyn = 0.3 ms, gmax =47 nS, and Erev = 0 mV. Directional arrows (top left) indicate dorsal, posterior, and lateral directions relative to the animal. B: delay for the arrival of the EPSP centroid at the SIZ relative to the EPSP centroid at the synapse. The centroid is the center of mass of the EPSP: ∫t · V(t)dt/∫ V(t)dt. Each compartment’s color reports the centroid delay for a synapse placed at that compartment. Inset: centroid delay measurement from a given pair of synaptic and SIZ EPSP traces (same sample data as in A). C: attenuation as a function of synaptic distance from origin of field A. Lsyn-SIZ (blue) and the ratio of peak SIZ and peak synaptic membrane potential (Vpeak-SIZ/Vpeak-syn; green) are shown, with each synaptic location in the excitatory dendritic field represented by a point. D: temporal delay as a function of distance from origin of field A. Centroid delay (blue) and delay of membrane potential peak (green) at the SIZ relative to synaptic peak. Each point represents a synaptic location.
