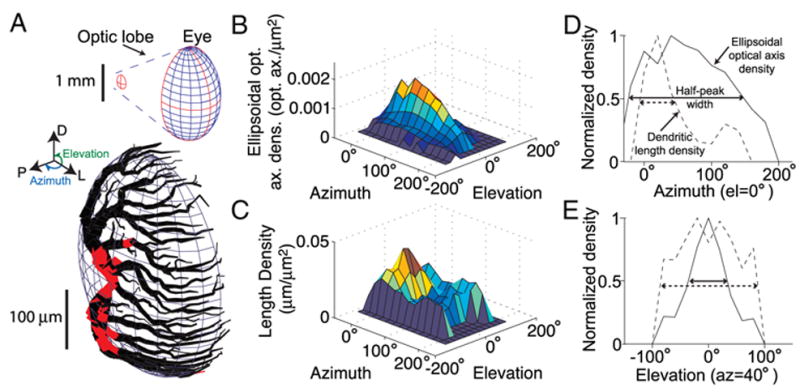
FIG. 4.

Comparison of dendritic length density with ellipsoidal optical axis density. A: LGMD excitatory dendritic field was fit to an ellipsoid to allow computation of dendritic length density relative to ellipsoid surface area. Red regions depict dendritic segments that are >10% of an ellipsoidal radius away from the ellipsoid surface. Top inset: shape of the eye-fitted ellipsoid, along with the LGMD’s excitatory dendritic field fitted ellipsoid (outlined in red) in the optic lobe. The relative orientation of the ellipsoids reflects their actual anatomical arrangement. Azimuth and elevation angles are illustrated in blue and green, respectively (left inset). An elevation of 0° corresponds to the eye equator with negative and positive elevations being ventral and dorsal relative to the animal, respectively. An azimuth of 0° corresponds to the front of the animal with an azimuth of 90° being perpendicular to the animal’s longitudinal body axis. B: ellipsoidal density of optical axes on the locust eye. Density was calculated by placing a 5° radius cap around every individual optical axis and counting the total number of optical axes in the cap, divided by the surface area of the eye ellipsoid falling into the cap (METHODS). Angular space was subsequently divided into a 20° resolution grid, and the average density of optical axes in each 20 × 20° region is shown in the plot. C: density of dendrite length on lgmda ellipsoid. The lgmda dendritic field was broken up into ~1,500 5-μm-long segments, and the segment endpoints were used as centers for 5° radius caps originating at the lgmda ellipsoid’s center. Density was computed by counting the total number of endpoints falling into the cap and dividing by the surface area of the lgmda ellipsoid in the cap. Angular space was subsequently divided into a 20° resolution grid, and the average density of dendrite in each 20 × 20° region is shown. D and E: comparison of ellipsoidal optical axis (solid line) and dendritic length (dashed line) density for a fixed elevation (0°, D) and fixed azimuth (40°, E). The density peaks were normalized to 1 and are equal to 0.069 opt. axes/μm2, 0.049 μm dendrite/μm2 (D) and 0.069 opt. axes/μm2, 0.037 μm dendrite/μm2 (E), respectively. The horizontal arrows show the angular width of each density at half-height.
