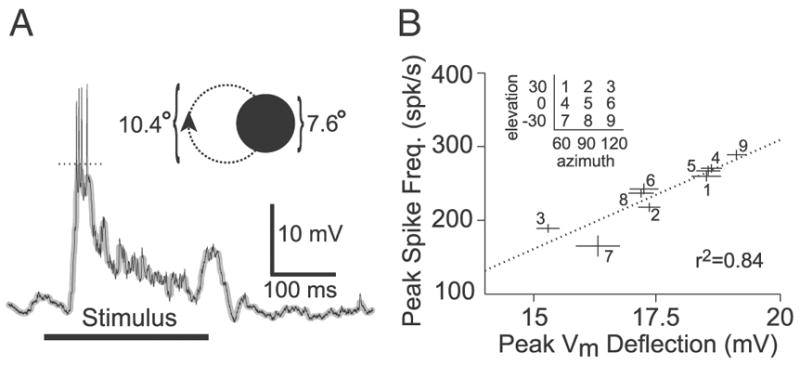
FIG. 6.

Transformation from peak spike frequency to membrane potential under local visual stimulation. A: example LGMD intracellular recording showing the response to a disk (diameter: 7.6°) rotating on a circular path (diameter: 10.4°; inset) at a speed of 4 cycle/s. The thick black horizontal line denotes the duration of stimulus presentation (250 ms). The thin black line is the membrane potential (Vm), and the superimposed thicker gray line is the median-filtered Vm. The dotted line shows the measured peak deflection in median-filtered Vm. Vm was –56 mV at baseline. B: correlation between peak Vm deflection and peak spike frequency. Every data point corresponds to a different stimulus location (inset), with lines showing SE. Data at each location was pooled across multiple trials (~25 per location-velocity combination, in this animal) and velocities of 1 and 4 cycle/s. The regression (dotted line) in this animal yielded r2 = 0.84 (mean r2 = 0.69 ± 0.20; n = 5).
