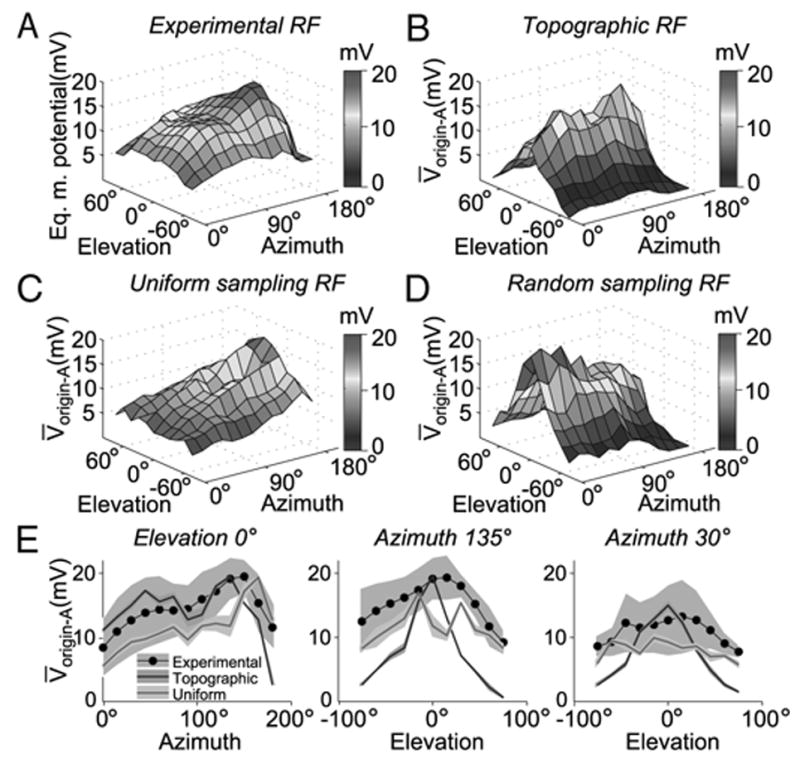
FIG. 7.

Comparison of the experimental LGMD receptive field (RF) with that obtained using 3 maps of visual to dendritic space in the compartmental model. A: experimental RF obtained by local stimulation at multiple elevations and azimuths (same stimulus as in Fig. 6). The LGMD/DCMD peak spike frequency (obtained from Krapp and Gabbiani 2005) was transformed to an equivalent LGMD peak membrane potential based on the regression depicted in Fig. 6B. B: simulated RF obtained using the topographic synaptic mapping. The plot shows the peak membrane potential at the origin of dendritic field A, V̄origin-A, elicited by a stimulus centered at a given point in visual space. The responses were simulated by activating a number of synapses equal to those covering the area of the disk at that location (see METHODS). Each synapse’s gmax was set to 47 nS so as to match maximal depolarization in the model to the experimental peak in A. C: simulated RF obtained with the uniform mapping of visual space. The plot reflects V̄origin-A for a given stimulus center (same stimuli as in B). Each synapse’s gmax was set to 84 nS to match maximal depolarization in the model to the experimental peak in A. D: simulated RF obtained using a random, 1-to-1 mapping from optical axes in visual space to the excitatory dendritic field (gmax = 47 nS). While the wiring scheme was randomized, the local density of optical axes was respected. The plot reflects V̄origin-A as a function of stimulus center azimuth and elevation. E: cross-sections of the experimental RF and those derived from the topographic, and uniform mappings. The left panel shows the V̄origin-A observed with stimuli of various azimuths with elevation fixed at 0°. The black line and gray background denote the experimental data mean and 95% confidence interval across animals (t-test; n = 6), respectively. The blue and red line denote the topographic and uniform sampling RF cross-sections, respectively. The shaded regions of the colored lines denote the 95% confidence interval for simulated runs (t-test; n = 10 trials per location). Middle and right: V̄ origin-A for various elevations with azimuth fixed at 135° (toward posterior end of animal) and 30° (toward anterior end of animal), respectively.
