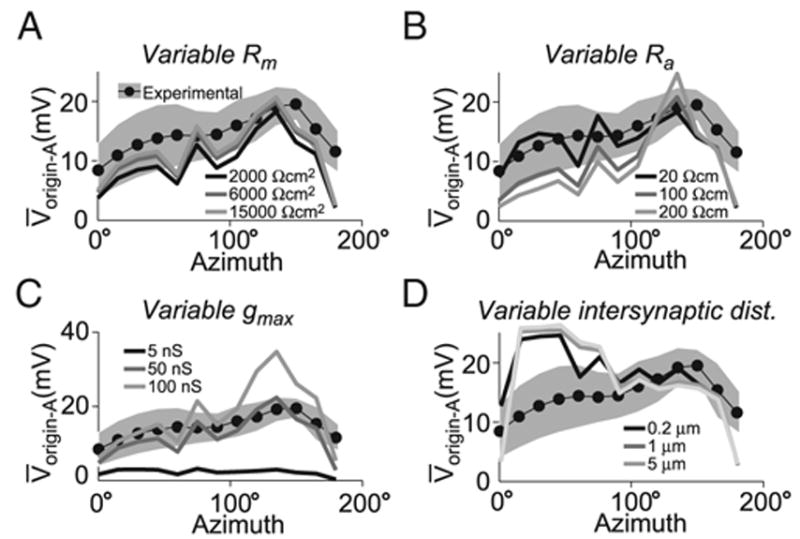
FIG. 8.

Receptive field robustness to simulation parameters. Each panel shows the V̄ origin-A observed with stimuli of various azimuths with elevation fixed at 0° for the topographic mapping. Effects seen at other elevations were qualitatively similar. Stimulation was as in Fig. 7. A: RF sensitivity to membrane resistance. The lines show RF cross-sections with Rm values of 2,000, 6,000, and 15,000 Ωcm2 (dark, medium, and light gray, respectively). B: RF sensitivity to intracellular resistivity. The lines show simulated RFs with Ra values of 20, 100, and 200 Ωcm (dark, medium and light gray, respectively). C: RF sensitivity to maximal synaptic conductance. Values for gmax were 5, 50, and 100 nS (dark, medium, and light gray, respectively). D: RF sensitivity to inter-synaptic distance. Synapses were spaced at equal increments along a contiguous dendritic segment starting from the dendritic segment closest to the center of mass in dendritic space of the synaptic sites receiving input from the same optical axes in the topographic mapping for a particular stimulus center (see METHODS). Inter-synaptic distance values were 0.2, 1, and 5 μm (dark, medium, and light gray, respectively).
