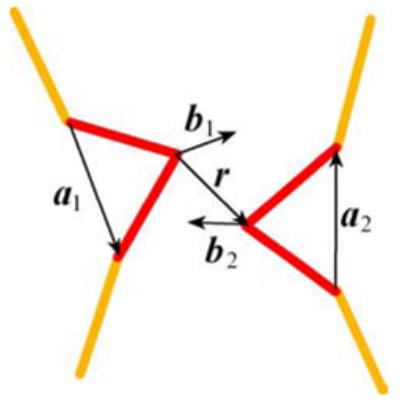
Figure 9.

Monte Carlo simulations of synapsis. The diagram shows variables that define the mutual orientation of the recombination sites (shown by red). The variables are used in the potential specified by Eq. (2) and for the definition of the synapsis. Vectors b1 and b2 are perpendicular to a1 and a2, respectively, and are in the planes of the sites. The angles which appear in Eq. (2) are defined as: .
