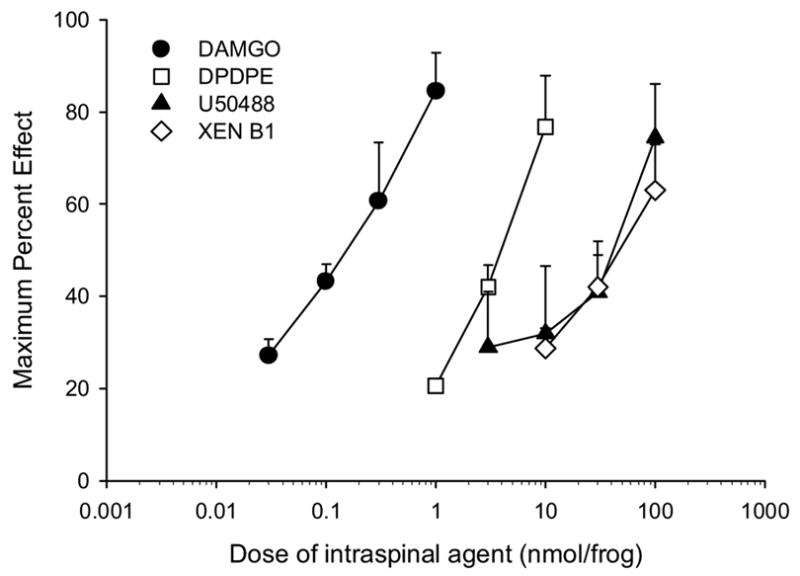
Figure 2.

Log dose-response curves of the antinociceptive effect of intraspinal xendorphin B1 compared with the mu opioid DAMGO, the delta opioid, DPDPE, and the kappa opioid, U50488. Drug groups are denoted in the legend on the graph (XEN B1 is xendorphin B1). Data points are plotted as mean peak effect (MPE + S.E.M.) of individual animals grouped for each agent and dose. N= 6–8 animals per dose. Selective opioid agonist curves are from previous studies [22] and provided here for comparison.
