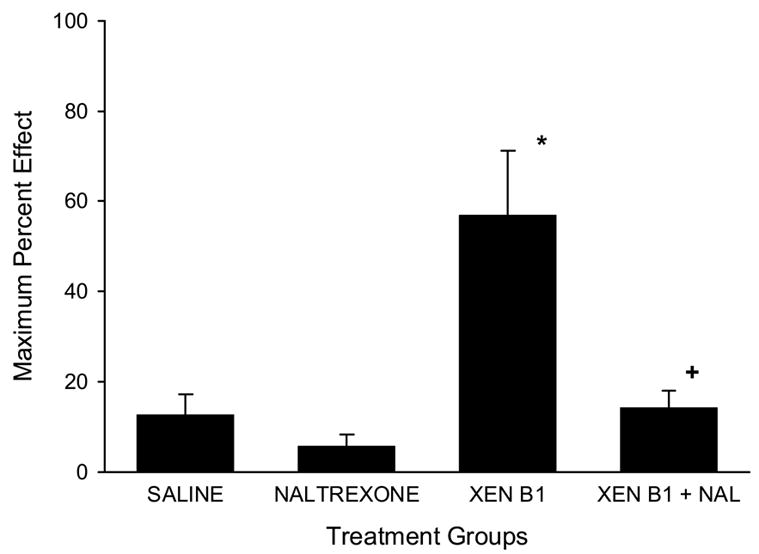
Figure 3.

Naltrexone antagonism of the antinociceptive effects of intraspinal xendorphin B1. Time course of the antinociceptive effect of intraspinal xendorphin B1 in amphibians. Treatment group are denoted as Saline (5 μl per animal, i.s.), Naltrexone (100 nmol/g, s.c.), XEN B1 (xendorphin B1, 30 nmol/frog, i.s.) and XEN B1 + NAL (Naltrexone at100 nmol/g, s.c. given 1 h before xendorphin B1 at 30 nmol/frog, i.s). Data points plotted as maximum MPE (+S.E.M.) values across the time course. N=6 animals per treatment group. Asterisk (*) denotes significantly different from SAL group at P<0.01; plus sign (+) denotes significantly different than XEN B1 group at P<0.01 (one-way ANOVA followed by Newman-Keuls post-hoc test).
