
Fig. 6.
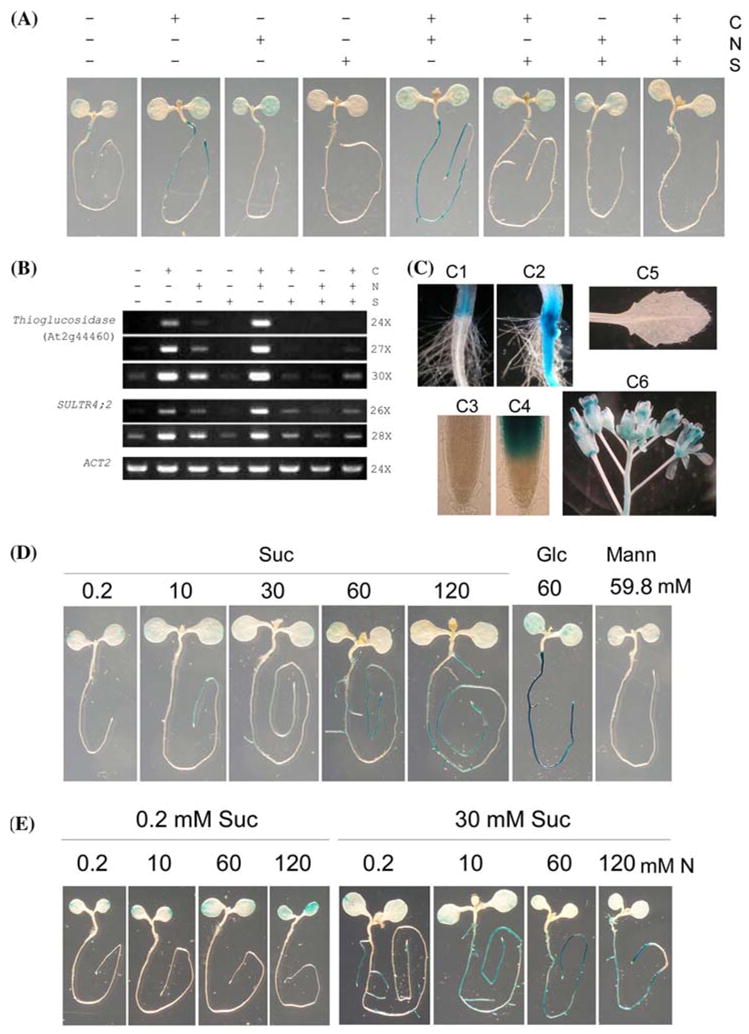
The putative thioglucosidase gene (At2g44460) promoter-driven GUS expression is differentially regulated by C, N and S nutrients in a tissue-specific manner. (A) GUS staining patterns under various C, N and S nutrient conditions. Five-day old seedlings were grown under half-strength MS basal salts supplemented with 1% sucrose and 1% agar were treated with various combinations of C, N and S liquid medium for 48 h and then stained for GUS activity for 3–5 h. +C, +N and +S indicate the presence of 60 mM sucrose, 60 mM total N (20 mM KNO3 and 20 mM NH4NO3), and 1.6001 mM respectively. −C, −N and −S represent the deficiencies of C (0.2 mM sucrose), N (0.2 mM total N), and 0.0001 mM (from CuSO4), respectively. (B) RT-PCR analysis of SULTR4;2 and the putative thioglucosidase gene expression under various C, N and S nutrient conditions. Five-day old seedlings were similarly treated by various combinations of C, N and S for 48 h (see legend in Fig. 6A) before RNA extraction. ACT2 was used as the internal control. PCR using 24, 27 and 30 cycles for the putative thioglucosidase gene and 26 and 28 cycles for SULTR4;2 were performed to differentiate the transcript abundance for every treatment. (C) Tissue-specific GUS expression patterns. Both the root-hypocotyl junctions (C1 and C2) and the root tips (C3 and C4) were shown to compare the effects of +S (C1 and C3) and −S (C2 and C4) treatments. A true leaf (C5) and flowers (C6) from a 30–day-old plant grown in the normal soil in the growth chamber were also shown. (D) GUS staining patterns under −S with various C levels. (E) GUS staining patterns under −S with various N levels at both low C and high C conditions. For (D) and (E), five-day old seedlings grown identically as in Fig. 6A were treated for 48 h before GUS staining. Suc, sucrose; Glc, glucose; Mann, mannitol