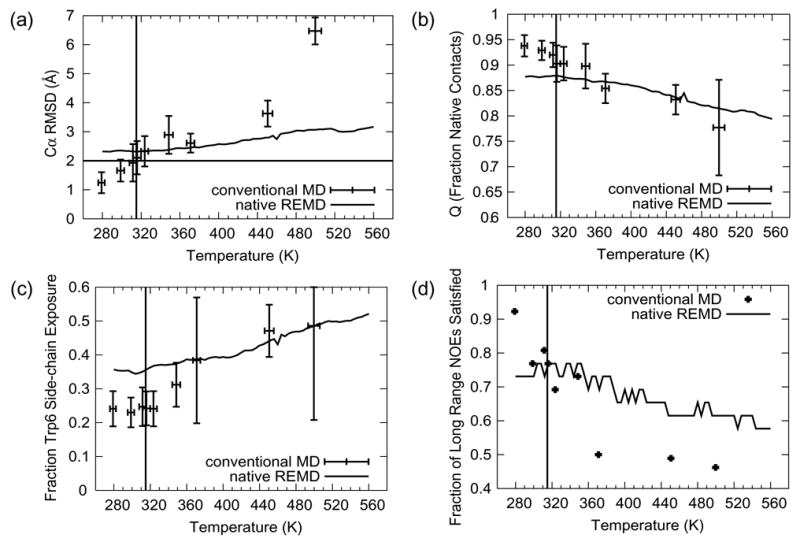
Figure 3. Average values of various folding metrics as a function of temperature/simulation time for the native REMD simulation and the conventional simulations.

For each conventional simulation the averaging interval was the final 10 ns of the simulation time. The vertical line in each panel is located at 315 K, the melting temperature from experiment (Qiu et al. 2002). (a) Cα RMSD from the SD minimized first of 20 member NMR models (Neidigh et al. 2002) (PDB code 1L2Y) with a horizontal line at 2.0 Å, the metric employed by Pitera and Swope (Pitera and Swope 2003) to denote the folded to unfolded transition. (b) Q, the fraction of native contacts. Two heavy atoms are considered to be in contact if they are within for 4.6 Å of each other (or within 5.4 Å if one or both of the atoms is a carbon atom). c) Side-chain SASA of the Trp 6 residue, calculated using the algorithm of Lee and Richards (Lee and Richards 1971) normalized by the mean side-chain SASA of the central Trp from a 100 ns simulation of GGWGG at 298 K. The GGWGG side-chain SASA reflects a fully exposed Trp.
